ไฟล์:India and South Asia Köppen climate map with legend.jpg
India_and_South_Asia_Köppen_climate_map_with_legend.jpg (545 × 537 พิกเซล, ขนาดไฟล์: 60 กิโลไบต์, ชนิดไมม์: image/jpeg)
| รูปภาพหรือไฟล์เสียงนี้ ต้นฉบับอยู่ที่ คอมมอนส์ รายละเอียดด้านล่าง เป็นข้อความที่แสดงผลจาก ไฟล์ต้นฉบับในคอมมอนส์
|
ความย่อ
| คำอธิบาย |
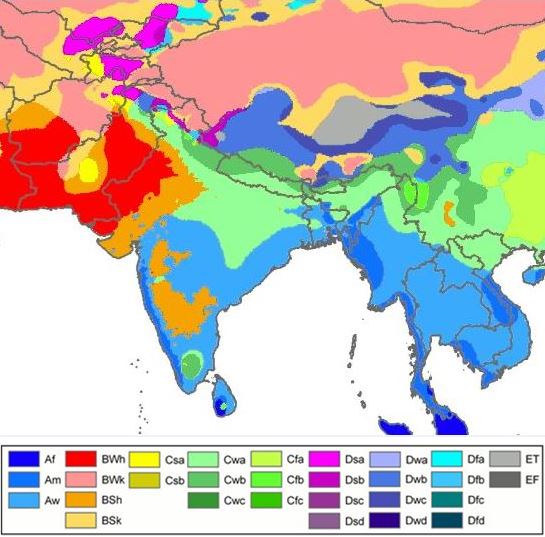
English: South Asia- Köppen-Geiger climate classification map is based on native vegetation, temperature, precipitation and their seasonality.
(Af) Tropical rainforest
(Am) Tropical monsoon
(Aw) Tropical savanna, wet & dry
(BWh) Hot desert
(BWk) Cold desert
(BSh) Hot semi arid
(BSk) Cold semi arid
(Csa) Mediterr. dry, hot summ.
(Cwa) Subtropical humid summ, dry winter
(Cwb) Subtropical highland, dry wint
(Cfa) Subtropical humid summ (no dry) |
| วันที่ | |
| แหล่งที่มา |
|
| ผู้สร้างสรรค์ |
File:World Köppen Map.png: Original file by Peel, M. C., Finlayson, B. L., and McMahon, T. A. (University of Melbourne). Derivative work: Modifications by user Br-Sc-94, (User talk). Cropping & addition of map legend-color box-to summary info by 2know4power, (User talk). |
Legend
| ภาพนี้ ได้รับการปรับแต่งภาพ ซึ่งหมายความว่าจะได้รับการเปลี่ยนแปลงภาพต่างจากต้นฉบับ การปรับปรุง: Climate change in 2009. ต้นฉบับสามารถดูได้ที่นี่: World Köppen Map.png. ปรับแต่งภาพโดย Br-Sc-94.
|
การอนุญาตใช้สิทธิ
- คุณสามารถ:
- ที่จะแบ่งปัน – ที่จะทำสำเนา แจกจ่าย และส่งงานดังกล่าวต่อไป
- ที่จะเรียบเรียงใหม่ – ที่จะดัดแปลงงานดังกล่าว
- ภายใต้เงื่อนไขต่อไปนี้:
- แสดงที่มา – คุณต้องให้เกียรติเจ้าของงานอย่างเหมาะสม โดยเพิ่มลิงก์ไปยังสัญญาอนุญาต และระบุหากมีการเปลี่ยนแปลง คุณอาจทำเช่นนี้ได้ในรูปแบบใดก็ได้ตามควร แต่ต้องไม่ใช่ในลักษณะที่แนะว่าผู้ให้อนุญาตสนับสนุนคุณหรือการใช้งานของคุณ
- อนุญาตแบบเดียวกัน – หากคุณดัดแปลง เปลี่ยนรูป หรือต่อเติมงานนี้ คุณต้องใช้สัญญาอนุญาตแบบเดียวกันหรือแบบที่เหมือนกับสัญญาอนุญาตที่ใช้กับงานนี้เท่านั้น
Explanatory notes
This map- File-India_and_South_Asia_Köppen_climate_map_with_legend.jpg is cropped from source map File:Köppen World Map (retouched version).png.[1] Some explanations are given below.
.png)
Lack of recording stations: Alps, Temperate zone in South India
Extent of Temperate climate markings ( “C” zone) in South India
In map File:Köppen World Map (retouched version).png-The Temperate climate markings ( “C” zone) are larger in Tropical South India, around Kodaikanal which is on the eastern side of Western Ghats mountains in Tamil Nadu state, at a higher elevation (~2300m). And also the temperate climate markings extend further South than expected. This is due to recordings from temperature station at Kodaikanal & lack of recording stations from nearby lowland areas, so markings could not be corrected due to lack of data.[1]
Extent of Alps in Europe marked as E zone; (Himalayas-high mountains- not marked as “E” zone)
In map File:Köppen World Map (retouched version).png-Alps high mountains are marked as “E” zone in this map. But “E” zone markings in the map for the Alps- high mountains do not cover the extent expected, because of lack of recording stations.[1] In this map, Himalayas -high mountains- are not marked as “E” zone.
Another map from a different source, shows no "C" zone in South India, Himalayas high mountains marked as "E" zone
Another map with reliable source is in references list given below. This map is based on data sets from the Climatic Research Unit (CRU) of the University of East Anglia and the Global Precipitation Climatology Centre (GPCC) at the German Weather Service.This is a digital Köppen–Geiger world map[2] on climate classification for the second half of the 20th century.
World Map of the Köppen-Geiger climate classification updated
This map[2] shows no temperate "C" zone in tropical South India & Himalayas high mountains are marked as polar "E" zone.
References
- ↑ a b c Peel, M. C. and Finlayson, B. L. and McMahon, T. A. (2007). "Updated world map of the Köppen–Geiger climate classification". Hydrol. Earth Syst. Sci. 11: 1633–1644. DOI:10.5194/hess-11-1633-2007. ISSN 1027-5606. (direct: Final Revised Paper).
- ↑ a b c d Kottek, M., J. Grieser, C. Beck, B. Rudolf, and F. Rubel (2006). "World Map of the Köppen–Geiger climate classification updated". Meteorol. Z. 15 (3): 259–263. DOI:10.1127/0941-2948/2006/0130. Retrieved on 2013-06-01.(direct- Kottek 2006 Paper)
Related maps
User Jeroenvrp made for these continents and areas a cropped and resized version:
- Africa Köppen Map.png
- Asia Köppen Map.png
- Australia-Oceania Köppen Map.png
- Europe Köppen Map.png
- North America Köppen Map.png
- Russia Köppen Map.png
- South America Köppen Map.png
- West Asia Köppen Map.png.
User LordToran made from the same data these maps:
- Klimagürtel-der-erde-eisklima.png
- Klimagürtel-der-erde-gemäßigte-zone.png
- Klimagürtel-der-erde-polargebiete.png
- Klimagürtel-der-erde-subtropen.png
- Klimagürtel-der-erde-tropen.png
- Klimagürtel-der-erde-tundra.png
- Klimagürtel-der-erde-warmgemäßigte-zone.png
- Klimagürtel-der-erde.png
- Klimagürtel-der-erde.svg
- Klimate-humidität.png
- Köppen-geiger-hessd-2007.svg
- Köppen-vereinfacht.svg
- Trockenklimate.png
ประวัติไฟล์
คลิกวันที่/เวลาเพื่อดูไฟล์ที่ปรากฏในขณะนั้น
| วันที่/เวลา | รูปย่อ | ขนาด | ผู้ใช้ | ความเห็น | |
|---|---|---|---|---|---|
| ปัจจุบัน | 10:28, 20 พฤศจิกายน 2558 | | 545 × 537 (60 กิโลไบต์) | 2know4power | User created page with UploadWizard |
หน้าที่มีภาพนี้
หน้าต่อไปนี้ โยงมาที่ภาพนี้:
การใช้ไฟล์ข้ามโครงการ
วิกิอื่นต่อไปนี้ใช้ไฟล์นี้:
- การใช้บน ast.wikipedia.org
- การใช้บน bn.wikipedia.org
- การใช้บน ca.wikipedia.org
- การใช้บน cs.wikipedia.org
- การใช้บน en.wikipedia.org
- การใช้บน eo.wikipedia.org
- การใช้บน es.wikipedia.org
- การใช้บน es.wikibooks.org
- การใช้บน fy.wikipedia.org
- การใช้บน gu.wikipedia.org
- การใช้บน hi.wikipedia.org
- การใช้บน ja.wikipedia.org
- การใช้บน lt.wikipedia.org
- การใช้บน ms.wikipedia.org
- การใช้บน ne.wikipedia.org
- การใช้บน nl.wikipedia.org
- การใช้บน sah.wikipedia.org
- การใช้บน simple.wikipedia.org
- การใช้บน sl.wikipedia.org
- การใช้บน sr.wikipedia.org
- การใช้บน tl.wikipedia.org
- การใช้บน yi.wikipedia.org