ไฟล์:Energy per capita.png
Energy_per_capita.png (800 × 370 พิกเซล, ขนาดไฟล์: 80 กิโลไบต์, ชนิดไมม์: image/png)
| รูปภาพหรือไฟล์เสียงนี้ ต้นฉบับอยู่ที่ คอมมอนส์ รายละเอียดด้านล่าง เป็นข้อความที่แสดงผลจาก ไฟล์ต้นฉบับในคอมมอนส์
|
ความย่อ

|
ภาพแผนที่ทางเศรษฐกิจนี้ ควรจะถูกสร้างใหม่เป็นกราฟิกส์เวกเตอร์ ซึ่งมีข้อดีอีกหลายประการ ดูเพิ่มเติมที่คอมมอนส์:สื่อต้องการเก็บกวาดสำหรับสารสนเทศเพิ่มเติม หากภาพนี้มีในรูปแบบกราฟิกส์เวกเตอร์อยู่แล้ว กรุณาอัปโหลดและแทนที่แม่แบบนี้ด้วย
{{vector version available|ชื่อภาพใหม่}}
แนะนำเป็นอย่างยิ่งให้ตั้งชื่อไฟล์เวกเตอร์ใหม่นั้นในรูปแบบ "Energy per capita.svg" แล้วใส่แม่แบบ Vector version available (หรือ Vva) ซึ่งไม่ต้องใช้พารามิเตอร์ ชื่อภาพใหม่ |
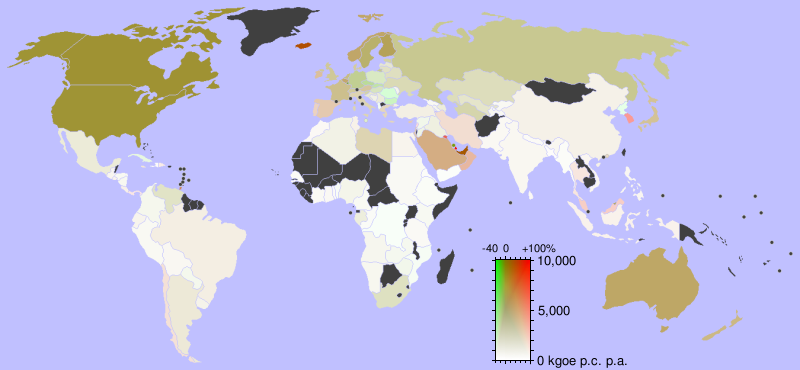
Energy Consumption in kilograms of oil equivalent (kgoe) per person per year per country (2001 data).
Darker tones indicate larger consumption (dark grey areas are missing from the dataset). Red hue indicates increasing consumption, green hue indicates decreasing consumption, in the time between 1990 and 2001.
The maximal consumption displayed is 10,000 kgoe p.c. p.a., the only countries with higher values being Qatar, Iceland and the United Arab Emirates. The change in consumption displayed ranges from -38% (Romania) to +94% (Qatar).
See also Image:CO2_per_capita_per_country.png
Data is from earthtrends.wri.org [1] archive copy at the Wayback Machine, sources:
- International Energy Agency (IEA), 2004.
- Energy Balances of OECD Countries (2003 Edition) and Energy Balances of non-OECD Countries (2003 Edition).
- Population Division of the Department of Economic and Social Affairs of the United Nations Secretariat, 2004.
- World Population Prospects: The 2002 Revision. Dataset on CD-ROM. New York: United Nations.
Data used (2001 and 1990 numbers):
Albania 549.3   809.4
Algeria 957.5   956.4
Angola  662.1   672.4
Argentina       1534.8  1384.7
Armenia 743.8   ..
Australia       5974.9  5183.3
Austria 3789.9  3240.0
Azerbaijan      1408.0  ..
Bahrain 9323.2  9855.1
Bangladesh      144.9   118.3
Belarus 2444.9  ..
Belgium 5743.3  4884.6
Benin   317.5   360.9
Bolivia 503.6   416.0
Bosnia and Herzegovina  1071.8  ..
Brazil  1063.5  893.7
Brunei  6339.2  5677.0
Bulgaria        2424.5  3305.8
Cameroon        417.7   431.4
Canada  7999.5  7548.1
C<F4>te d'Ivoire        403.6   353.5
Chile   1543.6  1040.5
China   886.5   753.4
Colombia        682.9   715.3
Congo (Kinshasa)        262.8   423.4
Congo (Brazaville)      302.1   318.7
Costa Rica      867.4   658.3
Croatia 1778.2  ..
Cuba    1214.7  1554.8
Cyprus  3109.0  2255.5
Czech Republic  4035.9  4599.4
Denmark 3706.1  3425.9
Dominican Republic      920.4   586.4
Ecuador 691.7   589.8
Egypt   694.6   574.2
El Salvador     676.2   496.1
Eritrea 200.4   ..
Estonia 3471.5  ..
Ethiopia        284.9   310.1
Finland 6517.9  5850.6
France  4458.6  4003.1
Gabon   1326.6  1350.5
Georgia 461.9   ..
Germany 4263.5  4484.5
Ghana   408.4   349.3
Gibraltar       6148.1  2629.6
Greece  2622.1  2183.2
Guatemala       623.6   511.7
Haiti   257.4   229.2
Honduras        488.9   496.3
Hong Kong       2358.8  1869.2
Hungary 2542.1  2746.5
Iceland 11800.0 8517.6
India   514.3   429.0
Indonesia       710.5   509.6
Iran    1784.5  1212.9
Iraq    1193.5  1201.8
Ireland 3876.1  3008.5
Israel  3432.6  2683.2
Italy   2990.2  2689.6
Jamaica 1540.1  1242.3
Japan   4091.5  3533.5
Jordan  987.1   1075.3
Kazakhstan      2596.0  ..
Kenya   495.0   529.1
North Korea     912.1   1647.3
South Korea     4131.8  2159.6
Kuwait  6956.2  3925.8
Kyrgyzstan      447.4   ..
Latvia  1827.7  ..
Lebanon 1536.6  851.4
Libyan Arab Jamahiriya  2994.8  2680.2
Lithuania       2302.8  ..
Luxembourg      8693.9  9447.1
Macedonia FYR   1281.6  ..
Malaysia        2196.8  1258.3
Malta   1887.5  2150.0
Mexico  1515.8  1490.3
Moldova 734.3   ..
Morocco 372.0   273.8
Mozambique      422.3   534.9
Myanmar 252.2   263.7
Namibia 600.5   ..
Nepal   349.8   311.7
Netherlands     4831.3  4447.0
Netherlands Antilles    6557.6  10957.4
New Zealand     4795.3  4171.4
Nicaragua       536.5   553.9
Nigeria 810.1   824.3
Norway  5920.6  5067.7
Oman    3714.3  2472.6
Pakistan        441.0   391.6
Panama  1057.5  618.0
Paraguay        670.2   732.2
Peru    459.5   457.5
Philippines     546.3   463.0
Poland  2343.3  2619.9
Portugal        2465.1  1733.3
Qatar   26888.3 13820.1
Romania 1642.0  2689.0
Russia  4288.8  ..
Saudi Arabia    4844.1  3674.9
Senegal 330.4   304.7
Serbia and Montenegro   1523.1  ..
Singapore       7103.0  4428.7
Slovakia        3470.0  4076.5
Slovenia        3439.6  ..
South Africa    2425.7  2475.8
Spain   3116.4  2320.7
Sri Lanka       422.5   327.7
Sudan   420.7   426.3
Sweden  5762.3  5452.4
Switzerland     3906.2  3673.7
Syria   822.4   938.0
Tajikistan      494.1   ..
Tanzania        391.3   376.2
Thailand        1227.2  794.6
Togo    303.5   289.7
Trinidad and Tobago     6717.9  4769.5
Tunisia 856.5   674.5
Turkey  1045.5  920.3
Turkmenistan    3243.4  ..
Ukraine 2872.3  ..
United Arab Emirates    11331.7 8654.1
United Kingdom  3993.8  3738.1
United States   7920.9  7538.1
Uruguay 803.0   724.7
Uzbekistan      2000.9  ..
Venezuela       2216.2  2252.0
Vietnam 496.9   373.7
Yemen   190.9   219.9
Zambia  607.7   667.0
Zimbabwe        774.7   867.9
การอนุญาตใช้สิทธิ

|
อนุญาตให้คัดลอก แจกจ่ายและ/หรือดัดแปรเอกสารนี้ภายใต้เงื่อนไขของสัญญาอนุญาตเอกสารเสรีของกนู รุ่น 1.2 หรือรุ่นใด ๆ นับจากนี้ที่ออกโดยมูลนิธิซอฟต์แวร์เสรี โดยไม่มีส่วนใดห้ามแก้ไข ไม่มีข้อความปกหน้าและปกหลัง สำเนาของสัญญาอนุญาตรวมอยู่ในส่วนชื่อ สัญญาอนุญาตเอกสารเสรีของกนู |
| ไฟล์นี้อยู่ภายใต้สัญญาอนุญาต ครีเอทีฟคอมมอนส์ แบบแสดงที่มา-อนุญาตแบบเดียวกัน 3.0 ต้นฉบับ | ||
| ||
| ป้ายแสดงสถานะลิขสิทธิ์นี้ถูกเพิ่มเพื่อให้เป็นไปตามการเปลี่ยนแปลงสัญญาอนุญาตของมูลนิธิวิกิมีเดีย จาก GFDL ไปยัง GFDL ควบคู่กับ CC-BY-SA 3.0 |
ประวัติไฟล์
คลิกวันที่/เวลาเพื่อดูไฟล์ที่ปรากฏในขณะนั้น
| วันที่/เวลา | รูปย่อ | ขนาด | ผู้ใช้ | ความเห็น | |
|---|---|---|---|---|---|
| ปัจจุบัน | 00:44, 8 เมษายน 2549 | | 800 × 370 (80 กิโลไบต์) | Dbachmann | correction |
| 23:37, 7 เมษายน 2549 |  | 800 × 370 (82 กิโลไบต์) | Dbachmann | correction | |
| 22:58, 7 เมษายน 2549 |  | 800 × 370 (83 กิโลไบต์) | Dbachmann | scale | |
| 19:04, 7 เมษายน 2549 |  | 800 × 370 (73 กิโลไบต์) | Dbachmann | Energy Consumption in kilograms of oil equivalent (kgoe) per person per year per country (2001 data). Darker tones indicate larger consumption (dark grey areas are missing from the dataset). Red hue indicates increasing consumption, green hue indicates d |
หน้าที่มีภาพนี้
หน้าต่อไปนี้ โยงมาที่ภาพนี้:
การใช้ไฟล์ข้ามโครงการ
วิกิอื่นต่อไปนี้ใช้ไฟล์นี้:
- การใช้บน af.wikipedia.org
- การใช้บน ar.wikipedia.org
- การใช้บน en.wikipedia.org
- การใช้บน es.wikipedia.org
- การใช้บน fa.wikipedia.org
- การใช้บน fi.wikipedia.org
- การใช้บน fr.wikipedia.org
- การใช้บน ha.wikipedia.org
- การใช้บน ko.wikipedia.org
- การใช้บน lt.wikipedia.org
- การใช้บน ml.wikipedia.org
- การใช้บน no.wikipedia.org
- การใช้บน pt.wikipedia.org
- การใช้บน ta.wikipedia.org
- การใช้บน uk.wikipedia.org
- การใช้บน vi.wikipedia.org
- การใช้บน zh-yue.wikipedia.org
- การใช้บน zh.wikipedia.org