ไฟล์:Vostok Petit data.svg

ดูภาพที่มีความละเอียดสูงกว่า ((ไฟล์ SVG, 1,024 × 768 พิกเซล, ขนาดไฟล์: 81 กิโลไบต์))
| รูปภาพหรือไฟล์เสียงนี้ ต้นฉบับอยู่ที่ คอมมอนส์ รายละเอียดด้านล่าง เป็นข้อความที่แสดงผลจาก ไฟล์ต้นฉบับในคอมมอนส์
|
ความย่อ
| คำอธิบาย |
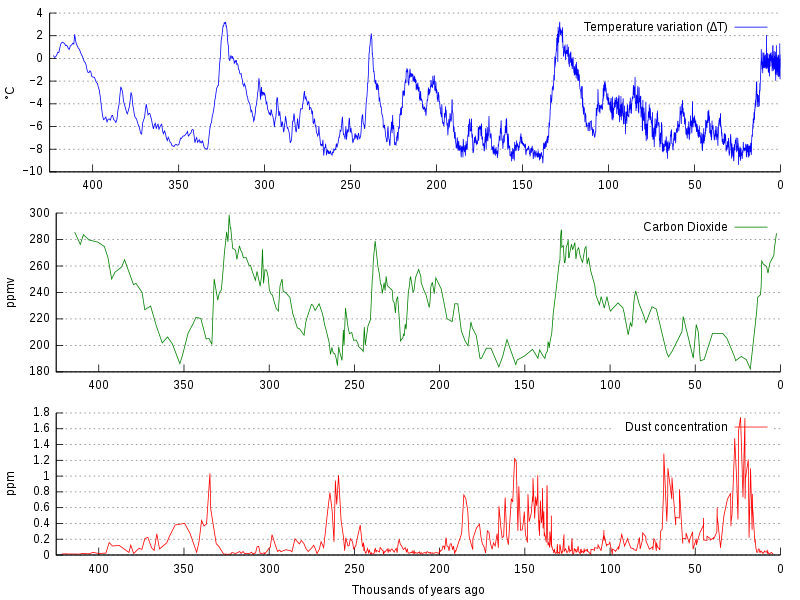
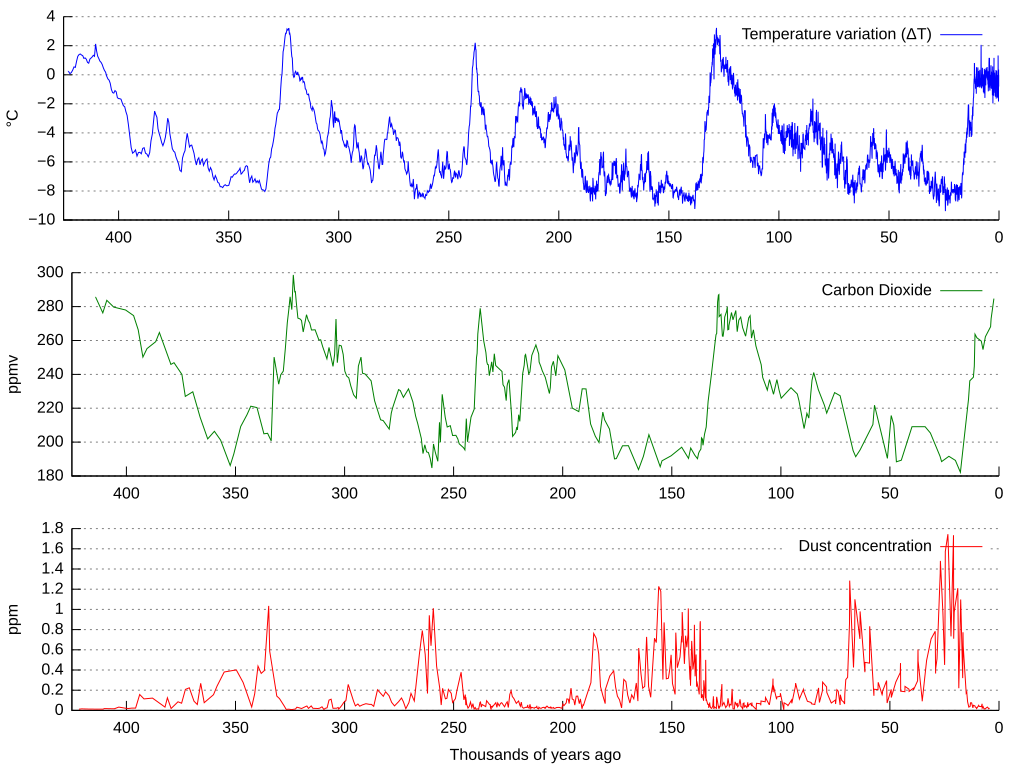
La bildo estas kopiita de wikipedia:en. La originala priskribo estas: Graph of CO2 (Green graph), temperature (Blue graph), and dust concentration (Red graph) measured from the Vostok, Antarctica ice core as reported by Petit et al., 1999. Higher dust levels are believed to be caused by cold, dry periods. The Earth's orbital eccentricity, tilt, and precession vary in a pattern over thousands of years. The IPCC notes that Milankovitch cycles drove the ice age cycles; CO2 followed temperature change "with a lag of some hundreds of years" (visible on a graph more zoomed in than this); and that as a feedback amplified temperature change. Among other factors, CO2 is more soluble in colder than in warmer waters. العربية: مخطّطٌ يُبيّن علاقة ثاني أوكسيد الكاربون ودرجة الحرارة وتركيز الغبار في قالب جليد فوستوك (بالإنجليزيّة: Vostok ice core) خلال 450,000 سنة الماضيّة |
| วันที่ | |
| แหล่งที่มา | Own work based on: Vostok-ice-core-petit.png โดย NOAA |
| ผู้สร้างสรรค์ |
ต้นฉบับ: Unknown เวกเตอร์: |
| เวอร์ชันอื่น |
ไฟล์อื่นที่ใช้ไฟล์นี้: |
| SVG genesis | ซอร์สโค้ดของ SVG นี้ตรวจสอบถูกต้องแล้ว ไฟล์ภาพกราฟิกส์เวกเตอร์นี้ สร้างขึ้นโดยใช้ Gnuplot This file is translated using SVG switch elements: all translations are stored in the same file. |
Data sets used are:
- ftp://ftp.ncdc.noaa.gov/pub/data/paleo/icecore/antarctica/vostok/deutnat.txt
- ftp://ftp.ncdc.noaa.gov/pub/data/paleo/icecore/antarctica/vostok/co2nat.txt
- ftp://ftp.ncdc.noaa.gov/pub/data/paleo/icecore/antarctica/vostok/dustnat.txt
รหัสต้นฉบับ
Gnuplot code
unset multiplot
set term svg size 1024,768
set output "vostok-data.svg"

set border 3
set xtics nomirror
set ytics nomirror
unset xlabel
unset ylabel

set grid y
set multiplot layout 3,1

set ylabel "°C"
plot [-425:0] [-10:4] \
        "deutnat.txt" \
        using (-$2/1000):4 \
        title "Temperature variation (ΔT)" \
        ls 3 \
        with lines

set ylabel "ppmv"
plot [-425:0] \
        "co2nat.txt" \
        using (-$1/1000):2 \
        title "Carbon Dioxide" \
        ls 2 \
        with lines

set xlabel "Thousands of years ago"
set ylabel "ppm"
plot [-425:0] \
        "dustnat.txt" \
        using (-$1/1000):2 \
        title "Dust concentration" \
        ls 1 \
        with lines
Explanation
After executing gnuplot, the resulting SVG file was manually changed to
* remove the negative signs for the x axis values
* change the [[:w:hyphen-minus|hyphen-minus]] characters in the temperature axis values to proper minus sign characters
| ไฟล์นี้อยู่ภายใต้สัญญาอนุญาต ครีเอทีฟคอมมอนส์ แบบแสดงที่มา-อนุญาตแบบเดียวกัน 3.0 ต้นฉบับ | ||
| ||
| ป้ายแสดงสถานะลิขสิทธิ์นี้ถูกเพิ่มเพื่อให้เป็นไปตามการเปลี่ยนแปลงสัญญาอนุญาตของมูลนิธิวิกิมีเดีย จาก GFDL ไปยัง GFDL ควบคู่กับ CC-BY-SA 3.0 |

|
อนุญาตให้คัดลอก แจกจ่ายและ/หรือดัดแปรเอกสารนี้ภายใต้เงื่อนไขของสัญญาอนุญาตเอกสารเสรีของกนู รุ่น 1.2 หรือรุ่นใด ๆ นับจากนี้ที่ออกโดยมูลนิธิซอฟต์แวร์เสรี โดยไม่มีส่วนใดห้ามแก้ไข ไม่มีข้อความปกหน้าและปกหลัง สำเนาของสัญญาอนุญาตรวมอยู่ในส่วนชื่อ สัญญาอนุญาตเอกสารเสรีของกนู |
บันทึกการอัพโหลด
This image is a derivative work of the following images:
- Vostok-ice-core-petit.png licensed with Cc-by-sa-3.0-migrated, GFDL
- 2006-02-15T20:38:10Z Maksim 598x441 (31557 Bytes) La bildo estas kopiita de wikipedia:en. La originala priskribo estas: Graph of [[carbon dioxide|CO2]], [[temperature]], and dust concentration measured from the [[Vostok, Antarctica]] [[ice core]] as reported by Petit et al.
Uploaded with derivativeFX
ประวัติไฟล์
คลิกวันที่/เวลาเพื่อดูไฟล์ที่ปรากฏในขณะนั้น
| วันที่/เวลา | รูปย่อ | ขนาด | ผู้ใช้ | ความเห็น | |
|---|---|---|---|---|---|
| ปัจจุบัน | 20:01, 25 มิถุนายน 2564 | | 1,024 × 768 (81 กิโลไบต์) | Matěj Orlický | File uploaded using svgtranslate tool (https://svgtranslate.toolforge.org/). Added translation for cs. |
| 05:25, 1 ธันวาคม 2556 |  | 1,024 × 768 (77 กิโลไบต์) | SeL media | time axis reversed | |
| 00:39, 26 กันยายน 2554 |  | 1,024 × 768 (309 กิโลไบต์) | Hel-hama | text improved | |
| 10:07, 27 เมษายน 2554 |  | 1,024 × 768 (83 กิโลไบต์) | Awickert | Didn't realize that it was a draw-on box instead of a measuring-box. Take 3! | |
| 10:05, 27 เมษายน 2554 |  | 1,024 × 768 (83 กิโลไบต์) | Awickert | [Shoot - last time, picked original instead of new version to upload] Manually moved axes in Inkscape such that the three plots line up with one another | |
| 10:02, 27 เมษายน 2554 |  | 1,024 × 768 (75 กิโลไบต์) | Awickert | Manually moved axes in Inkscape such that the three plots line up with one another | |
| 20:25, 20 มิถุนายน 2553 |  | 1,024 × 768 (75 กิโลไบต์) | Autopilot | {{Information |Description=La bildo estas kopiita de wikipedia:en. La originala priskribo estas: Graph of CO<sub>2</sub> (Green graph), temperature (Blue graph), and dust concentration (Red graph) measured from the [[Vostok, Antarc |
หน้าที่มีภาพนี้
หน้าต่อไปนี้ โยงมาที่ภาพนี้:
การใช้ไฟล์ข้ามโครงการ
วิกิอื่นต่อไปนี้ใช้ไฟล์นี้:
- การใช้บน af.wikipedia.org
- การใช้บน ar.wikipedia.org
- การใช้บน be.wikipedia.org
- การใช้บน bg.wikipedia.org
- การใช้บน ca.wikipedia.org
- การใช้บน cs.wikipedia.org
- การใช้บน cy.wikipedia.org
- การใช้บน da.wikipedia.org
- การใช้บน de.wikipedia.org
- การใช้บน en.wikipedia.org
- Climate variability and change
- Global cooling
- Ice core
- Orbital forcing
- Quaternary glaciation
- Carbon dioxide in Earth's atmosphere
- Talk:Ice age/Archive 1
- File talk:Vostok Petit data.svg
- List of periods and events in climate history
- User talk:Jc-S0CO/Archives/2013/2
- User:Mark Buchanan/sandbox/QuatGlac
- User:Mark Buchanan/sandbox/Glaciation-WIP
- Portal:Climate change
- Talk:Climate variability and change/Archive 8
- การใช้บน en.wikiversity.org
- การใช้บน es.wikipedia.org
- การใช้บน eu.wikipedia.org
- การใช้บน fa.wikipedia.org
- การใช้บน fi.wikipedia.org
- การใช้บน fi.wikiversity.org
- การใช้บน fr.wikipedia.org
- การใช้บน gl.wikipedia.org
- การใช้บน ha.wikipedia.org
- การใช้บน he.wikipedia.org
- การใช้บน it.wikipedia.org
- การใช้บน ja.wikipedia.org
ดูการใช้ข้ามโครงการเพิ่มเติมของไฟล์นี้