ไฟล์:Oil consumption per day by region from 1980 to 2006.svg

ขนาดของตัวอย่าง PNG นี้ของไฟล์ SVG นี้: 600 × 450 พิกเซล ความละเอียดอื่น: 320 × 240 พิกเซล | 640 × 480 พิกเซล | 1,024 × 768 พิกเซล | 1,280 × 960 พิกเซล | 2,560 × 1,920 พิกเซล
ดูภาพที่มีความละเอียดสูงกว่า ((ไฟล์ SVG, 600 × 450 พิกเซล, ขนาดไฟล์: 204 กิโลไบต์))
| รูปภาพหรือไฟล์เสียงนี้ ต้นฉบับอยู่ที่ คอมมอนส์ รายละเอียดด้านล่าง เป็นข้อความที่แสดงผลจาก ไฟล์ต้นฉบับในคอมมอนส์
|
| คำอธิบาย |
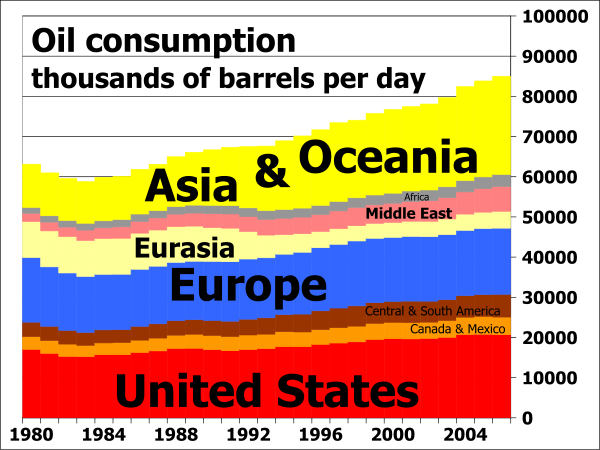
English: Oil consumption in daily barrels per region from 1980 to 2006; vertical extents indicate barrels of oil consumed per day, and the horizontal scale shows years from 1980 to 2007. |
| วันที่ | |
| แหล่งที่มา |
I, 84user, created this work using the excel file RecentPetroleumConsumptionBarrelsperDay.xls from the U.S. Energy Information Administration's web page http://tonto.eia.doe.gov/dnav/pet/pet_pri_wco_k_w.htm (direct link: http://www.eia.doe.gov/emeu/international/RecentPetroleumConsumptionBarrelsperDay.xls) and using Open Source Gnumeric 1.9.1 to produce the chart. See also  |
| ผู้สร้างสรรค์ | 84user |
| การอนุญาต (การใช้ไฟล์นี้ใหม่) |
PD-SELF; Released into the public domain (by the author). |
| เวอร์ชันอื่น |
 |
See also


การอนุญาตใช้สิทธิ
| งานนี้ได้ถูกเผยแพร่สู่สาธารณสมบัติโดยเจ้าของ 84user ซึ่งมีผลทั่วโลก ในบางประเทศ การกระทำดังกล่าวอาจไม่สามารถทำได้ตามกฎหมาย |
ประวัติไฟล์
คลิกวันที่/เวลาเพื่อดูไฟล์ที่ปรากฏในขณะนั้น
| วันที่/เวลา | รูปย่อ | ขนาด | ผู้ใช้ | ความเห็น | |
|---|---|---|---|---|---|
| ปัจจุบัน | 21:52, 25 ตุลาคม 2551 | | 600 × 450 (204 กิโลไบต์) | 84user | increased main title font size |
| 21:31, 25 ตุลาคม 2551 |  | 600 × 450 (195 กิโลไบต์) | 84user | {{Information |Description={{en|Oil consumption in daily barrels per region from 1980 to 2006; vertical extents indicate barrels of oil consumed per day, and the horizontal scale shows years from 1980 to 2007.}} |Source=I, 84user, created this work using |
หน้าที่มีภาพนี้
หน้าต่อไปนี้ โยงมาที่ภาพนี้:
การใช้ไฟล์ข้ามโครงการ
วิกิอื่นต่อไปนี้ใช้ไฟล์นี้:
- การใช้บน en.wikipedia.org
- การใช้บน es.wikipedia.org
- การใช้บน fa.wikipedia.org
- การใช้บน id.wikipedia.org
- การใช้บน ko.wikipedia.org
- การใช้บน ur.wikipedia.org