ไฟล์:Components of the Cryosphere.tif
ขนาดของตัวอย่าง PNG นี้ของไฟล์ TIF นี้: 463 × 599 พิกเซล ความละเอียดอื่น: 185 × 240 พิกเซล | 371 × 480 พิกเซล | 593 × 768 พิกเซล | 791 × 1,024 พิกเซล | 2,048 × 2,650 พิกเซล
ดูภาพที่มีความละเอียดสูงกว่า (2,048 × 2,650 พิกเซล, ขนาดไฟล์: 20.91 เมกะไบต์, ชนิดไมม์: image/tiff)
| รูปภาพหรือไฟล์เสียงนี้ ต้นฉบับอยู่ที่ คอมมอนส์ รายละเอียดด้านล่าง เป็นข้อความที่แสดงผลจาก ไฟล์ต้นฉบับในคอมมอนส์
|
ความย่อ
| คำอธิบาย |
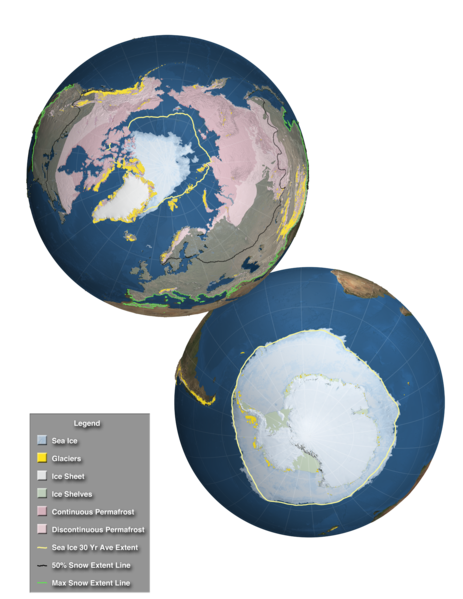
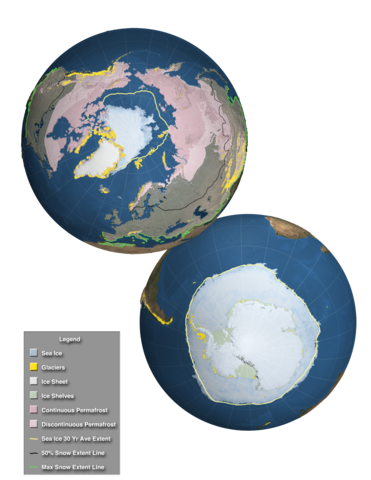
English: This high resolution image, designed for the Fifth Assessment Report of the Intergovernmental Panel on Climate Change, shows the extent of the regions affected by components of the cryosphere around the world. Over land, continuous permafrost is shown in a dark pink while discontinuous permafrost is shown in a lighter shade of pink. Over much of the northern hemisphere's land area, a semi-transparent white veil depicts the regions that are affected by snowfall at least one day during the perion 2000-2012. The bright green line along the southern border of this region shows the maximum snow extent while a black line across the North America, Europe and Asia shows the 50% snow extent line. Glaciers are shown as small golden dots in mountainous areas and in the far northern and southern latitudes. Over the water, ice shelves are shown around Antarctica along with sea ice surrounding the ice shelves. Sea ice is also shown at the North Pole. For both poles. the 30 year average sea ice extent is shown by a yellow outline. In addition, the ice sheets of Greenland and Antarctica are clearly visible. |
| วันที่ | |
| แหล่งที่มา | Goddard Multimedia |
| ผู้สร้างสรรค์ | NASA/Goddard Space Flight Center Scientific Visualization Studio |
การอนุญาตใช้สิทธิ
| ภาพนี้เป็นสาธารณสมบัติ เนื่องจากเป็นภาพที่สร้างขึ้นโดยองค์การบริหารการบินและอวกาศแห่งชาติ (NASA) ซึ่งตามนโยบายด้านลิขสิทธิ์ของนาซาระบุไว้ว่า "ภาพและสื่อต่าง ๆ ของนาซาไม่ได้รับการคุ้มครองโดยลิขสิทธิ์ยกเว้นจะระบุไว้ว่ามีลิขสิทธิ์" ดูเพิ่มที่ หน้านโยบายด้านลิขสิทธิ์ของนาซา หรือ นโยบายการใช้ภาพของ JPL | ||
 |
คำเตือน:
|
ประวัติไฟล์
คลิกวันที่/เวลาเพื่อดูไฟล์ที่ปรากฏในขณะนั้น
| วันที่/เวลา | รูปย่อ | ขนาด | ผู้ใช้ | ความเห็น | |
|---|---|---|---|---|---|
| ปัจจุบัน | 21:22, 3 ธันวาคม 2556 |  | 2,048 × 2,650 (20.91 เมกะไบต์) | Originalwana | {{Information |Description ={{en|1=This high resolution image, designed for the Fifth Assessment Report of the Intergovernmental Panel on Climate Change, shows the extent of the regions affected by components of the cryosphere around the world. Over... |
หน้าที่มีภาพนี้
หน้าต่อไปนี้ โยงมาที่ภาพนี้:
การใช้ไฟล์ข้ามโครงการ
วิกิอื่นต่อไปนี้ใช้ไฟล์นี้:
- การใช้บน azb.wikipedia.org
- การใช้บน de.wikipedia.org
- การใช้บน es.wikipedia.org
- การใช้บน eu.wikipedia.org
- การใช้บน fr.wiktionary.org
- การใช้บน he.wikipedia.org
- การใช้บน hi.wikipedia.org
- การใช้บน ja.wikipedia.org
- การใช้บน ky.wikipedia.org
- การใช้บน la.wikipedia.org
- การใช้บน sr.wikipedia.org
- การใช้บน sv.wikipedia.org
- การใช้บน vi.wikipedia.org
- การใช้บน www.wikidata.org
- การใช้บน zh-yue.wikipedia.org