65_Myr_Climate_Change.png(650 × 397 พิกเซล, ขนาดไฟล์: 21 กิโลไบต์, ชนิดไมม์: image/png)

Wikimedia Commons logo รูปภาพหรือไฟล์เสียงนี้ ต้นฉบับอยู่ที่ คอมมอนส์ รายละเอียดด้านล่าง เป็นข้อความที่แสดงผลจาก ไฟล์ต้นฉบับในคอมมอนส์
คอมมอนส์เป็นเว็บไซต์ในโครงการสำหรับเก็บรวบรวมสื่อเสรี ที่ คุณสามารถช่วยได้

ความย่อ

คำอธิบาย
English:
Expanded view of climate change during the last five million years, showing the rapid oscillations in the glacial state.
View of climate change extending back through the last 540 million years, including many cycles of change from warm to cold and back again.

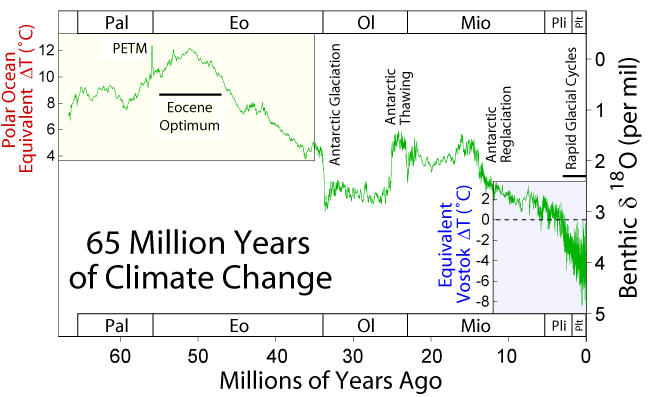
This figure shows climate change over the last 65 million years. The data are based on a compilation of oxygen isotope measurements (δ18O) on benthic foraminifera by Zachos et al. (2001) which reflect a combination of local temperature changes in their environment and changes in the isotopic composition of sea water associated with the growth and retreat of continental ice sheets.

Because it is related to both factors, it is not possible to uniquely tie these measurements to temperature without additional constraints. For the most recent data, an approximate relationship to temperature can be made by observing that the oxygen isotope measurements of Lisiecki and Raymo (2005) are tightly correlated to temperature changes at Vostok as established by Petit et al. (1999). Present day is indicated as 0. For the oldest part of the record, when temperatures were much warmer than today, it is possible to estimate temperature changes in the polar oceans (where these measurements were made) based on the observation that no significant ice sheets existed and hence all fluctuation in (δ18O) must result from local temperature changes (as reported by Zachos et al.).

The intermediate portion of the record is dominated by large fluctuations in the mass of the Antarctic ice sheet, which first nucleates approximately 34 million years ago, then partially dissipates around 25 million years ago, before re-expanding towards its present state 13 million years ago. These fluctuations make it impossible to constrain temperature changes without additional controls.

Significant growth of ice sheets did not begin in Greenland and North America until approximately 3 million years ago, following the formation of the Isthmus of Panama by continental drift. This ushered in an era of rapidly cycling glacials and interglacials (see figure at upper right).

Also appearing on this graph are the Eocene Climatic Optimum, an extended period of very warm temperatures, and the Paleocene-Eocene Thermal Maximum (labeled PETM). The PETM is very short lived high temperature excursion possibly associated with the destablization of methane clathrates and the rapid buildup of greenhouse gases in the atmosphere. Due to the coarse sampling and averaging involved in this record, it is likely that the full magnitude of the PETM is underestimated by a factor of 2-4 times its apparent height.
วันที่ 17 December 2005
แหล่งที่มา งานของตัว
ผู้สร้างสรรค์ Robert A. Rohde
การอนุญาต
(การใช้ไฟล์นี้ใหม่)
This figure was prepared by Robert A. Rohde from published and publicly available data and is incorporated into the Global Warming Art project.

การอนุญาตใช้สิทธิ

Image from Global Warming Art
This image is an original work created for Global Warming Art. Please refer to the image description page for more information.
GNU head อนุญาตให้คัดลอก แจกจ่ายและ/หรือดัดแปรเอกสารนี้ภายใต้เงื่อนไขของสัญญาอนุญาตเอกสารเสรีของกนู รุ่น 1.2 หรือรุ่นใด ๆ นับจากนี้ที่ออกโดยมูลนิธิซอฟต์แวร์เสรี โดยไม่มีส่วนใดห้ามแก้ไข ไม่มีข้อความปกหน้าและปกหลัง สำเนาของสัญญาอนุญาตรวมอยู่ในส่วนชื่อ สัญญาอนุญาตเอกสารเสรีของกนู
w:th:ครีเอทีฟคอมมอนส์
แสดงที่มา อนุญาตแบบเดียวกัน
ไฟล์นี้อยู่ภายใต้สัญญาอนุญาต ครีเอทีฟคอมมอนส์ แบบแสดงที่มา-อนุญาตแบบเดียวกัน 3.0 ต้นฉบับ
คุณสามารถ:
  • ที่จะแบ่งปัน – ที่จะทำสำเนา แจกจ่าย และส่งงานดังกล่าวต่อไป
  • ที่จะเรียบเรียงใหม่ – ที่จะดัดแปลงงานดังกล่าว
ภายใต้เงื่อนไขต่อไปนี้:
  • แสดงที่มา – คุณต้องให้เกียรติเจ้าของงานอย่างเหมาะสม โดยเพิ่มลิงก์ไปยังสัญญาอนุญาต และระบุหากมีการเปลี่ยนแปลง คุณอาจทำเช่นนี้ได้ในรูปแบบใดก็ได้ตามควร แต่ต้องไม่ใช่ในลักษณะที่แนะว่าผู้ให้อนุญาตสนับสนุนคุณหรือการใช้งานของคุณ
  • อนุญาตแบบเดียวกัน – หากคุณดัดแปลง เปลี่ยนรูป หรือต่อเติมงานนี้ คุณต้องใช้สัญญาอนุญาตแบบเดียวกันหรือแบบที่เหมือนกับสัญญาอนุญาตที่ใช้กับงานนี้เท่านั้น
ป้ายแสดงสถานะลิขสิทธิ์นี้ถูกเพิ่มเพื่อให้เป็นไปตามการเปลี่ยนแปลงสัญญาอนุญาตของมูลนิธิวิกิมีเดีย จาก GFDL ไปยัง GFDL ควบคู่กับ CC-BY-SA 3.0


Notes

  • The data is plotted as a 10 point average of the original data to minimize measurement noise.
  • The absolute calibration of the early part of the record relative to modern-day is somewhat uncertain, so that the entire scale may need to be shifted ± a few degrees for a true comparison to present.
  • The labels on the top and bottom of the figure are abbreviations for different geologic epochs of the geologic time scale.
  • The data shown is very useful, when observing a long period of time.

References

  • Lisiecki, L. E., and M. E. Raymo (2005). "A Pliocene-Pleistocene stack of 57 globally distributed benthic δ18O records" (PDF). Paleoceanography 20: 1003. doi:10.1029/2004PA001071.[ลิงก์เสีย]
  • Petit J.R., Jouzel J., Raynaud D., Barkov N.I., Barnola J.M., Basile I., Bender M., Chappellaz J., Davis J., Delaygue G., Delmotte M., Kotlyakov V.M., Legrand M., Lipenkov V., Lorius C., Pépin L., Ritz C., Saltzman E., Stievenard M. (1999). "Climate and Atmospheric History of the Past 420,000 years from the Vostok Ice Core, Antarctica". Nature 399: 429–436.
  • Zachos, James, Mark Pagani, Lisa Sloan, Ellen Thomas, and Katharina Billups (2001). "Trends, Rhythms, and Aberrations in Global Climate 65 Ma to Present". Science 292 (5517): 686–693. doi:10.1126/science.1059412.

derivative works

ไฟล์อื่นที่ใช้ไฟล์นี้:

คำบรรยายโดยย่อ

เพิ่มคำบรรยายทรรทัดเดียวเพื่อขยายความว่าไฟล์นี้มีอะไร

ไอเทมที่แสดงอยู่ในไฟล์นี้

ประกอบด้วย

media type อังกฤษ

image/png

checksum อังกฤษ

fde0e20cdda21a80377578d80f730e3bed593b68

data size อังกฤษ

21,498 ไบต์

397 พิกเซล

650 พิกเซล

ประวัติไฟล์

คลิกวันที่/เวลาเพื่อดูไฟล์ที่ปรากฏในขณะนั้น

วันที่/เวลารูปย่อขนาดผู้ใช้ความเห็น
ปัจจุบัน20:15, 18 กรกฎาคม 2553รูปย่อสำหรับรุ่นเมื่อ 20:15, 18 กรกฎาคม 2553650 × 397 (21 กิโลไบต์)SeL mediatime axis reversed
05:51, 18 ธันวาคม 2548รูปย่อสำหรับรุ่นเมื่อ 05:51, 18 ธันวาคม 2548650 × 397 (25 กิโลไบต์)Saperaud~commonswiki*'''Description:''' [[en:Image:{{subst:PAGENAME}}]]

ไม่มีหน้าใดโยงมาที่ภาพนี้

การใช้ไฟล์ข้ามโครงการ

วิกิอื่นต่อไปนี้ใช้ไฟล์นี้:

ดูการใช้ข้ามโครงการเพิ่มเติมของไฟล์นี้