ไฟล์:3 phase rectification 2.svg

ขนาดของตัวอย่าง PNG นี้ของไฟล์ SVG นี้: 397 × 600 พิกเซล ความละเอียดอื่น: 159 × 240 พิกเซล | 317 × 480 พิกเซล | 508 × 768 พิกเซล | 677 × 1,024 พิกเซล | 1,355 × 2,048 พิกเซล | 624 × 943 พิกเซล
ดูภาพที่มีความละเอียดสูงกว่า ((ไฟล์ SVG, 624 × 943 พิกเซล, ขนาดไฟล์: 120 กิโลไบต์))
| รูปภาพหรือไฟล์เสียงนี้ ต้นฉบับอยู่ที่ คอมมอนส์ รายละเอียดด้านล่าง เป็นข้อความที่แสดงผลจาก ไฟล์ต้นฉบับในคอมมอนส์
|
ความย่อ
| คำอธิบาย |
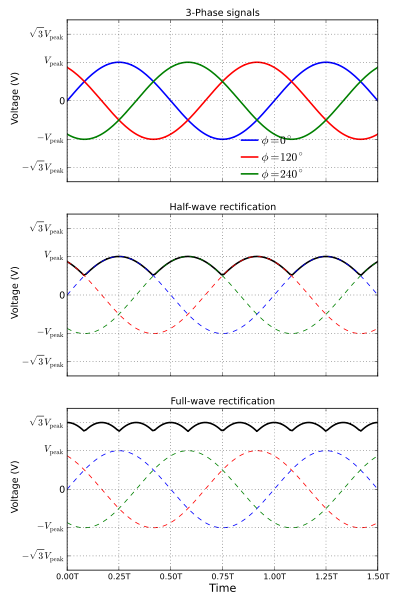
English: Waveforms for a typical 3-phase half-wave and full-wave rectifiers. The top plot shows the individual three phase signals, the middle plot shows the half-wave rectifier output in solid curve and the bottom plot shows the full-wave rectifier output in solid curve. The 'T' in time is the time period of individual signals and is the amplitude of each of the three input signals.
The diagram was created using python, matplotlib and numpy.
Русский: Формы сигналов трёхфазного одно- и двухполупериодного выпрямителей. Сверху - отдельные трехфазные сигналы, средний график - выход однополупериодного выпрямителя сплошной линией, нижний график - выходной сигнал двухполупериодного выпрямителя сплошной линией. T - период, U - напряжения. |
||
| วันที่ | |||
| แหล่งที่มา | งานของตัว | ||
| ผู้สร้างสรรค์ | Krishnavedala | ||
| เวอร์ชันอื่น |
3 phase rectification 2.png
[]
.png:
.jpg:
|
||
| SVG genesis | ซอร์สโค้ดของ SVG นี้ตรวจสอบถูกต้องแล้ว ไฟล์ภาพกราฟิกส์เวกเตอร์นี้ สร้างขึ้นโดยใช้ Matplotlib | ||
| รหัสต้นฉบับ | Python code
|


การอนุญาตใช้สิทธิ
ข้าพเจ้า ในฐานะผู้ถือลิขสิทธิ์ของภาพหรือสื่อนี้ อนุญาตให้ใช้ภาพหรือสื่อนี้ภายใต้เงื่อนไขต่อไปนี้
ไฟล์นี้อยู่ภายใต้สัญญาอนุญาต ครีเอทีฟคอมมอนส์ แบบแสดงที่มา-อนุญาตแบบเดียวกัน 3.0 ต้นฉบับ
- คุณสามารถ:
- ที่จะแบ่งปัน – ที่จะทำสำเนา แจกจ่าย และส่งงานดังกล่าวต่อไป
- ที่จะเรียบเรียงใหม่ – ที่จะดัดแปลงงานดังกล่าว
- ภายใต้เงื่อนไขต่อไปนี้:
- แสดงที่มา – คุณต้องให้เกียรติเจ้าของงานอย่างเหมาะสม โดยเพิ่มลิงก์ไปยังสัญญาอนุญาต และระบุหากมีการเปลี่ยนแปลง คุณอาจทำเช่นนี้ได้ในรูปแบบใดก็ได้ตามควร แต่ต้องไม่ใช่ในลักษณะที่แนะว่าผู้ให้อนุญาตสนับสนุนคุณหรือการใช้งานของคุณ
- อนุญาตแบบเดียวกัน – หากคุณดัดแปลง เปลี่ยนรูป หรือต่อเติมงานนี้ คุณต้องใช้สัญญาอนุญาตแบบเดียวกันหรือแบบที่เหมือนกับสัญญาอนุญาตที่ใช้กับงานนี้เท่านั้น

|
อนุญาตให้คัดลอก แจกจ่ายและ/หรือดัดแปรเอกสารนี้ภายใต้เงื่อนไขของสัญญาอนุญาตเอกสารเสรีของกนู รุ่น 1.2 หรือรุ่นใด ๆ นับจากนี้ที่ออกโดยมูลนิธิซอฟต์แวร์เสรี โดยไม่มีส่วนใดห้ามแก้ไข ไม่มีข้อความปกหน้าและปกหลัง สำเนาของสัญญาอนุญาตรวมอยู่ในส่วนชื่อ สัญญาอนุญาตเอกสารเสรีของกนู |
คุณสามารถเลือกสัญญาอนุญาตดังกล่าวตามต้องการ
ประวัติไฟล์
คลิกวันที่/เวลาเพื่อดูไฟล์ที่ปรากฏในขณะนั้น
| วันที่/เวลา | รูปย่อ | ขนาด | ผู้ใช้ | ความเห็น | |
|---|---|---|---|---|---|
| ปัจจุบัน | 22:52, 23 กันยายน 2554 | | 624 × 943 (120 กิโลไบต์) | Krishnavedala | individual plots are now consistent with each other |
| 00:24, 23 กันยายน 2554 |  | 624 × 943 (114 กิโลไบต์) | Krishnavedala | final correction, hopefully!! | |
| 00:20, 23 กันยายน 2554 |  | 640 × 943 (116 กิโลไบต์) | Krishnavedala | corrected Time coordinates | |
| 00:04, 23 กันยายน 2554 |  | 623 × 943 (115 กิโลไบต์) | Krishnavedala | Corrected the waveforms for the full wave rectification. | |
| 05:06, 1 กรกฎาคม 2554 |  | 599 × 944 (175 กิโลไบต์) | Spinningspark | Fixed correct use of italics. Fixed annotation outside boundary of image. Output waveform on top of input waveforms. | |
| 02:29, 1 กรกฎาคม 2554 |  | 599 × 944 (111 กิโลไบต์) | Krishnavedala | removed "(sec)" from the x-axis label | |
| 02:27, 1 กรกฎาคม 2554 |  | 599 × 946 (111 กิโลไบต์) | Krishnavedala | edits from suggestions in here | |
| 02:51, 18 มิถุนายน 2554 |  | 524 × 874 (142 กิโลไบต์) | Krishnavedala | thinner dashed lines | |
| 02:48, 18 มิถุนายน 2554 |  | 524 × 874 (142 กิโลไบต์) | Krishnavedala | all plots on the same scale to avoid confusion | |
| 00:18, 9 มิถุนายน 2554 |  | 594 × 946 (223 กิโลไบต์) | Krishnavedala | correction in the labels |
หน้าที่มีภาพนี้
หน้าต่อไปนี้ โยงมาที่ภาพนี้:
การใช้ไฟล์ข้ามโครงการ
วิกิอื่นต่อไปนี้ใช้ไฟล์นี้:
- การใช้บน ca.wikipedia.org
- การใช้บน cs.wikipedia.org
- การใช้บน el.wikipedia.org
- การใช้บน en.wikipedia.org
- การใช้บน eo.wikipedia.org
- การใช้บน eu.wikipedia.org
- การใช้บน ja.wikipedia.org
- การใช้บน zh.wikipedia.org