Partial_transmittance.gif(367 × 161 พิกเซล, ขนาดไฟล์: 67 กิโลไบต์, ชนิดไมม์: image/gif, วนซ้ำ, 53 เฟรม, 4.2 วินาที)

Wikimedia Commons logo รูปภาพหรือไฟล์เสียงนี้ ต้นฉบับอยู่ที่ คอมมอนส์ รายละเอียดด้านล่าง เป็นข้อความที่แสดงผลจาก ไฟล์ต้นฉบับในคอมมอนส์
คอมมอนส์เป็นเว็บไซต์ในโครงการสำหรับเก็บรวบรวมสื่อเสรี ที่ คุณสามารถช่วยได้

ความย่อ

คำอธิบาย
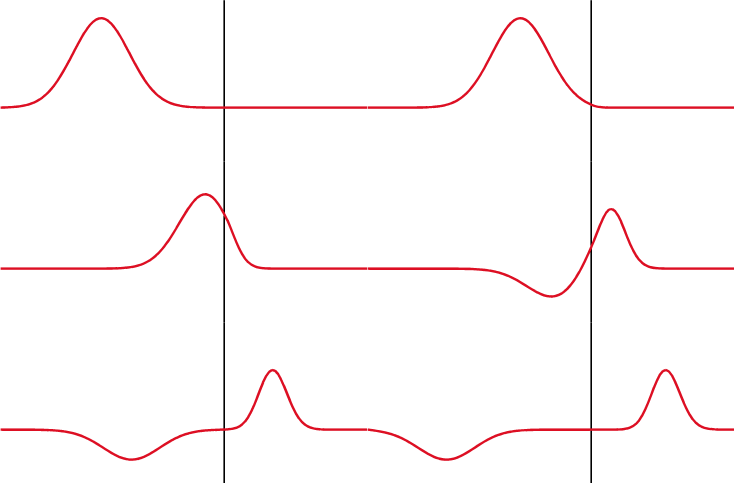
Русский: Показано классическое отражение/прохождение солитона гауссового импульса от/в более плотную среду. В реальности же, свет отражается не от поверхности, а от всех частиц тела (см. ru:КЭД).
English: Illustration of partial reflection of a wave. A gaussian wave on a one-dimensional string strikes a boundary with transmission coefficient of 0.5. Half the wave is transmitted and half is reflected.
Français : Illustration de la réflection partielle d'une onde. Une onde gaussienne se déplaçant sur un ressort unidimensionnel est réfléchie/transmise au niveau d'une interface avec un coefficient de transmission de 0.5.
Español: Ilustración de una reflexión parcial de una onda. Una onda gaussiana sobre una cuerda de una dimensión choca contra un limite con un coeficiente de transmisión de 0.5. La mitad de la onda es transmitida y la otra mitad es reflejada.
วันที่
แหล่งที่มา self-made with MATLAB, source code below
ผู้สร้างสรรค์ Oleg Alexandrov
 
ไฟล์GIF ภาพกราฟิกส์เวกเตอร์นี้ สร้างขึ้นโดยใช้ MATLAB

การอนุญาตใช้สิทธิ

Public domain ข้าพเจ้า ผู้ถือลิขสิทธิ์ในงานนี้ ขอมอบงานให้เป็นสาธารณสมบัติ ประกาศนี้มีผลทั่วโลก
ในบางประเทศ การกระทำดังกล่าวอาจไม่สามารถทำได้ตามกฎหมาย
ข้าพเจ้าอนุญาตให้ทุกคนมีสิทธิ์ในการใช้ไฟล์นี้ในทุกเหตุผลการใช้ โดยไม่มีมีเงื่อนไข เว้นแต่กฎหมายไม่อนุญาตให้ทำเช่นนั้น

MATLAB source code

% Partial transmittance and reflectance of a wave
% Code is messed up, don't have time to clean it now
function main()
 
   % KSmrq's colors
   red    = [0.867 0.06 0.14];
   blue   = [0, 129, 205]/256;
   green  = [0, 200,  70]/256;
   yellow = [254, 194,   0]/256;
   white = 0.99*[1, 1, 1];
   black = [0, 0, 0];
 
   % length of the string and the grid
   L = 5;
   N = 151;
   X=linspace(0, L, N);
 
   h = X(2)-X(1); % space grid size
   c = 0.01; % speed of the wave
   tau = 0.25*h/c; % time grid size
 
   % form a medium with a discontinuous wave speed
   C = 0*X+c;
 
   D=L/2;
   c_right = 0.5*c; % speed to the right of the disc
   for i=1:N
      if X(i) > D
         C(i) = c_right;
      end
   end
   % Now C = c for x < D, and C=c_right for x > D
 
   K = 5; % steepness of the bump
   S = 0; % shift the wave
   f=inline('exp(-K*(x-S).^2)', 'x', 'S', 'K'); % a gaussian as an initial wave
   df=inline('-2*K*(x-S).*exp(-K*(x-S).^2)', 'x', 'S', 'K'); % derivative of f
 
   % wave at time 0 and tau
   U0 = 0*f(X, S, K);
   U1 = U0 - 2*tau*c*df(X, S, K);
 
   U = 0*U0; % current U
 
   % plot between Start and End
   Start=130; End=500;
 
   % hack to capture the first period of the wave
   min_k = 2*N; k_old = min_k; turn_on = 0; 
 
   frame_no = 0;
   for j=1:End
 
      %  fixed end points
      U(1)=0; U(N)=0;
 
      % finite difference discretization in time
      for i=2:(N-1)
         U(i) = (C(i)*tau/h)^2*(U1(i+1)-2*U1(i)+U1(i-1)) + 2*U1(i) - U0(i);
      end
 
      % update info, for the next iteration
      U0 = U1; U1 = U;
 
      spacing=7;
 
     % plot the wave
      if rem(j, spacing) == 1 & j > Start
 
         figure(1); clf; hold on;
         axis equal; axis off; 
         lw = 3; % linewidth
 
         % size of the window
         ys = 1.2;
 
         low = -0.5*ys;
         high = ys;
         plot([D, D], [low, high], 'color', black, 'linewidth', 0.7*lw)
%         fill([X(1), D, D, X(1)], [low, low, high, high], [0.9, 1, 1], 'edgealpha', 0);
%         fill([D X(N), X(N), D],  [low, low, high, high], [1, 1, 1], 'edgealpha', 0);
 
         plot(X, U, 'color', red, 'linewidth', lw);
 
         % plot the ends of the string
         small_rad = 0.06;
 
         axis([-small_rad, 0.82*L, -ys, ys]);
 
         % small markers to keep the bounding box fixed when saving to eps
         plot(-small_rad, ys, '*', 'color', white);
         plot(L+small_rad, -ys, '*', 'color', white);
 
         pause(0.1)
         frame_no = frame_no + 1;
         %frame=sprintf('Frame%d.eps', 1000+frame_no); saveas(gcf, frame, 'psc2');
         frame=sprintf('Frame%d.png', 1000+frame_no);% saveas(gcf, frame);
         disp(frame)
         print (frame, '-dpng', '-r300');
 
      end
   end
 
 
% The gif image was creating with the command
% convert -antialias -loop 10000  -delay 8 -compress LZW -scale 20% Frame10*png Partial_transmittance.gif
% and was later cropped in Gimp

คำบรรยายโดยย่อ

เพิ่มคำบรรยายทรรทัดเดียวเพื่อขยายความว่าไฟล์นี้มีอะไร

ไอเทมที่แสดงอยู่ในไฟล์นี้

ประกอบด้วย

ประวัติไฟล์

คลิกวันที่/เวลาเพื่อดูไฟล์ที่ปรากฏในขณะนั้น

วันที่/เวลารูปย่อขนาดผู้ใช้ความเห็น
ปัจจุบัน23:36, 9 เมษายน 2553รูปย่อสำหรับรุ่นเมื่อ 23:36, 9 เมษายน 2553367 × 161 (67 กิโลไบต์)Aiyizooptimized animation
12:56, 26 พฤศจิกายน 2550รูปย่อสำหรับรุ่นเมื่อ 12:56, 26 พฤศจิกายน 2550367 × 161 (86 กิโลไบต์)Oleg Alexandrov{{Information |Description=Illustration of en:Transmission coefficient (optics) |Source=self-made with MATLAB, source code below |Date=~~~~~ |Author= Oleg Alexandrov |Permission=PD-self, see below |other_versions= }} {{PD-se

หน้าต่อไปนี้ โยงมาที่ภาพนี้:

การใช้ไฟล์ข้ามโครงการ

วิกิอื่นต่อไปนี้ใช้ไฟล์นี้:

ดูการใช้ข้ามโครงการเพิ่มเติมของไฟล์นี้