ไฟล์:OECD Social Expenditure by Braunch.svg

ขนาดของตัวอย่าง PNG นี้ของไฟล์ SVG นี้: 800 × 400 พิกเซล ความละเอียดอื่น: 320 × 160 พิกเซล | 640 × 320 พิกเซล | 1,024 × 512 พิกเซล | 1,280 × 640 พิกเซล | 2,560 × 1,280 พิกเซล | 1,260 × 630 พิกเซล
ดูภาพที่มีความละเอียดสูงกว่า ((ไฟล์ SVG, 1,260 × 630 พิกเซล, ขนาดไฟล์: 196 กิโลไบต์))
| รูปภาพหรือไฟล์เสียงนี้ ต้นฉบับอยู่ที่ คอมมอนส์ รายละเอียดด้านล่าง เป็นข้อความที่แสดงผลจาก ไฟล์ต้นฉบับในคอมมอนส์
|

|
This file may be updated to reflect new information. If you wish to use a specific version of the file without new updates being mirrored, please upload the required version as a separate file. |
ความย่อ
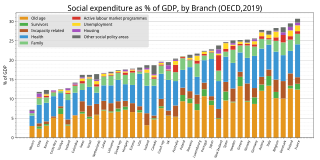
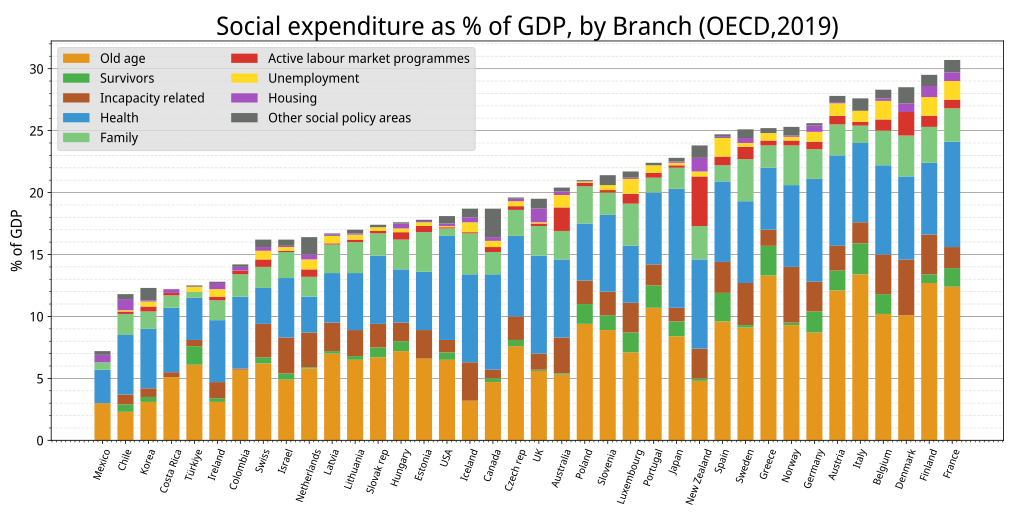
| คำอธิบาย | Social Expenditure as % of GDP by Braunch, (OECD 2019) |
| วันที่ | |
| แหล่งที่มา |
งานของตัว, Data from OECD SOCX https://stats.oecd.org/Index.aspx?DataSetCode=SOCX_AGG |
| ผู้สร้างสรรค์ | Yuasan |
| การอนุญาต (การใช้ไฟล์นี้ใหม่) |
CC-0 |
การอนุญาตใช้สิทธิ
ข้าพเจ้า ในฐานะผู้ถือลิขสิทธิ์ของภาพหรือสื่อนี้ อนุญาตให้ใช้ภาพหรือสื่อนี้ภายใต้เงื่อนไขต่อไปนี้
| ไฟล์นี้มีให้ใช้ภายใต้ CC0 1.0 Universal Public Domain Dedication ของครีเอทีฟคอมมอนส์ | |
| The person who associated a work with this deed has dedicated the work to the public domain by waiving all of their rights to the work worldwide under copyright law, including all related and neighboring rights, to the extent allowed by law. You can copy, modify, distribute and perform the work, even for commercial purposes, all without asking permission.
|
Graph data
import numpy as np
from cycler import cycler
import matplotlib.pyplot as plt
import pandas as pd

df = pd.read_csv("data.tsv", index_col=0 , sep = "\t")
df = df.sort_values(by=["Total"], ascending=True).fillna(0)
df1 = df.drop('Total', axis=1).T

#plt.rcParams["axes.prop_cycle"] = plt.cycler("color", plt.get_cmap("tab20")(np.linspace(0,1,12)))
plt.rcParams['axes.prop_cycle'] = cycler(color=['#e5961d', '#4DAF4A', '#B15928', '#3b95d3', '#7FC97F', '#d7352b', '#ffd924', '#a652c1', '#686d69'])

fig, ax = plt.subplots(figsize=(14, 7))
for i in range( len(df1) ):
	ax.bar(df1.columns, df1.iloc[i] , width=0.7, bottom=df1.iloc[:i].sum())

ax.legend(df.columns, fontsize=13,  loc='upper left', ncol=2,  frameon=True, facecolor="#dddddd")
ax.set_axisbelow(True)

plt.rcParams['font.family'] = 'sans-serif'
plt.rcParams['font.sans-serif'] = ['Noto Sans Display']
plt.subplots_adjust(left=0.05, bottom=0.14, right=0.98, top=0.92)

plt.title("Social expenditure as % of GDP, by Branch (OECD,2019)", fontsize=25)
plt.tick_params(labelsize=10, pad=4)

plt.xticks(df.index, rotation=70, size=10)
plt.yticks(fontsize=13)
plt.ylabel("% of GDP", size=15)

ax.minorticks_on()
plt.grid(which='major',color='#999999',linestyle='-', axis="y")
plt.grid(which='minor',color='#e3e3e3',linestyle='--', axis="y")

plt.savefig("image.svg")
ประวัติไฟล์
คลิกวันที่/เวลาเพื่อดูไฟล์ที่ปรากฏในขณะนั้น
| วันที่/เวลา | รูปย่อ | ขนาด | ผู้ใช้ | ความเห็น | |
|---|---|---|---|---|---|
| ปัจจุบัน | 21:56, 24 กุมภาพันธ์ 2566 | | 1,260 × 630 (196 กิโลไบต์) | Yuasan | 2019 data |
| 16:53, 13 กรกฎาคม 2564 |  | 1,440 × 720 (153 กิโลไบต์) | Yuasan | 2017 data | |
| 15:22, 30 พฤศจิกายน 2558 |  | 735 × 416 (139 กิโลไบต์) | Yuasan | 2011 | |
| 08:41, 6 พฤษภาคม 2557 |  | 746 × 438 (106 กิโลไบต์) | Yuasan | User created page with UploadWizard |
หน้าที่มีภาพนี้
หน้าต่อไปนี้ โยงมาที่ภาพนี้:
การใช้ไฟล์ข้ามโครงการ
วิกิอื่นต่อไปนี้ใช้ไฟล์นี้:
- การใช้บน en.wikipedia.org
- การใช้บน eo.wikipedia.org
- การใช้บน ja.wikipedia.org
- การใช้บน ko.wikipedia.org
- การใช้บน la.wikipedia.org
- การใช้บน tr.wikipedia.org
- การใช้บน zh-yue.wikipedia.org